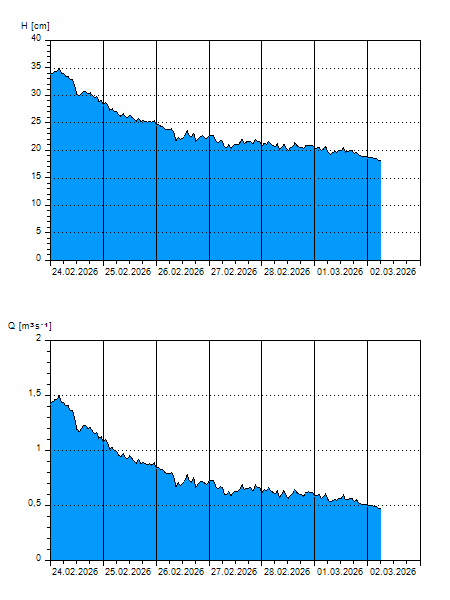
Water Levels and Discharges  |  Reservoirs  |  Precipitation  |  Water quality Last site revision 20.03.2026 00:08
             
Water Levels and Discharges CAUTION: All data are without validation 20.03.2026 00:11:46
 Station  Mníšek  River  Jeřice
Floods
1st level of flood emergency  1st level of flood emergency  60[cm]
2nd level of flood emergency  2nd level of flood emergency  80[cm]
3rd level of flood emergency  3rd level of flood emergency  100[cm]
State of extreme flood  3rd level of flood emergency  (!State of extreme flood) (Q50)221[cm]
Remark
low flow rates
low flow rates Q355:0,130 [m3.s-1]
QN [m3.s-1]
Q1Q2Q5Q10Q20Q50Q100
7,76012,6021,9031,6043,6063,9082,60
 Historical floods (3 highest recorded for a period of observation)
07.08.201090,00 [m3.s-1] N ~>>100
 [m3.s-1] N ~
 [m3.s-1] N ~
Graf
  H [cm]
Q [m3.s-1]
QN
20.03.2026 00:00 13 0,220
19.03.2026 23:00 13 0,215
19.03.2026 22:00 13 0,233
19.03.2026 21:00 13 0,225
19.03.2026 20:00 13 0,234
19.03.2026 19:00 13 0,232
19.03.2026 18:00 13 0,241
19.03.2026 17:00 13 0,228
19.03.2026 16:00 13 0,231
19.03.2026 15:00 13 0,238
19.03.2026 14:00 13 0,237
19.03.2026 13:00 13 0,245
19.03.2026 12:00 13 0,245
19.03.2026 11:00 13 0,238
19.03.2026 10:00 13 0,229
19.03.2026 09:00 13 0,219
19.03.2026 08:00 13 0,241
19.03.2026 07:00 13 0,239
19.03.2026 06:00 13 0,232
19.03.2026 05:00 13 0,233
19.03.2026 04:00 13 0,234
19.03.2026 03:00 13 0,238
19.03.2026 02:00 13 0,240
19.03.2026 01:00 13 0,253
18.03.2026 07:00 13 0,218
17.03.2026 07:00 12 0,193
16.03.2026 07:00 14 0,266
15.03.2026 07:00 13 0,241
14.03.2026 07:00 13 0,220
H — water level
Q — Discharge
QNQN
 Cross Section
Přícný profil
This information is also available through the application for mobile phones with Android OS (only in the Czech language)  Water Levels and Discharges
  Povodí Labe, státní podnik © 2026 The system uses also data from measuring stations of   Czech Hydrometeorological Institute © 2026 Application developed by   MGE Data s.r.o. © 1996 - 2020