 |
| |
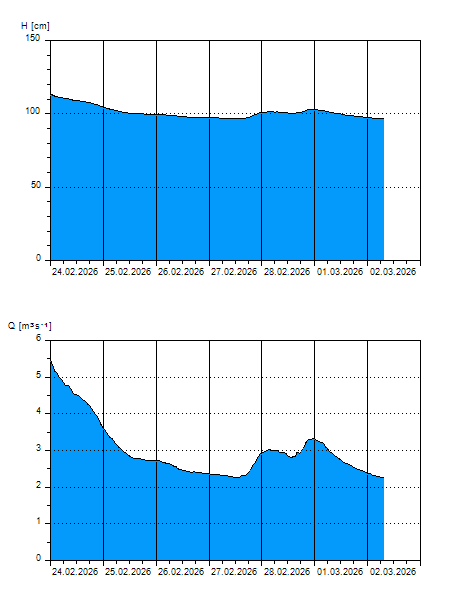
H
[cm]
|
Q
[m3.s-1]
|
QN
|
|
30.06.2026 05:45
| 82 |
0,703
|
|
|
30.06.2026 05:30
| 82 |
0,719
|
|
|
30.06.2026 05:15
| 82 |
0,719
|
|
|
30.06.2026 05:00
| 82 |
0,719
|
|
|
30.06.2026 04:00
| 82 |
0,742
|
|
|
30.06.2026 03:00
| 83 |
0,766
|
|
|
30.06.2026 02:00
| 83 |
0,789
|
|
|
30.06.2026 01:00
| 83 |
0,782
|
|
|
30.06.2026 00:00
| 83 |
0,758
|
|
|
29.06.2026 23:00
| 83 |
0,774
|
|
|
29.06.2026 22:00
| 83 |
0,821
|
|
|
29.06.2026 21:00
| 84 |
0,844
|
|
|
29.06.2026 20:00
| 82 |
0,719
|
|
|
29.06.2026 19:00
| 81 |
0,656
|
|
|
29.06.2026 18:00
| 81 |
0,656
|
|
|
29.06.2026 17:00
| 81 |
0,617
|
|
|
29.06.2026 16:00
| 80 |
0,578
|
|
|
29.06.2026 15:00
| 80 |
0,550
|
|
|
29.06.2026 14:00
| 79 |
0,525
|
|
|
29.06.2026 13:00
| 79 |
0,519
|
|
|
29.06.2026 12:00
| 79 |
0,519
|
|
|
29.06.2026 11:00
| 79 |
0,507
|
|
|
29.06.2026 10:00
| 79 |
0,507
|
|
|
29.06.2026 09:00
| 79 |
0,525
|
|
|
29.06.2026 08:00
| 79 |
0,507
|
|
|
29.06.2026 07:00
| 79 |
0,513
|
|
|
28.06.2026 07:00
| 79 |
0,519
|
|
|
27.06.2026 07:00
| 80 |
0,531
|
|
|
26.06.2026 07:00
| 80 |
0,537
|
|
|
25.06.2026 07:00
| 80 |
0,562
|
|
|
24.06.2026 07:00
| 80 |
0,586
|
|
H — water level
Q — Discharge
QN — QN |